Integer Linear Programming with PuLP: Optimizing a DraftKings NFL lineup
Creating a simple optimizer for my fantasy league.

Like more than 20% of Americans, I was invited to participate in a fantasy football league this year. One key problem: I don’t watch football and don’t know any of the players. Let’s try to automate the creation of my weekly lineup and create a consistent baseline for the other players to compare against!
I used this opportunity to learn the basics of PuLP, a Python package for optimization, constraint satisfaction, and linear programming. Creating lineups is a perfect test case, since we have a series of hard constraints (such as needing a single quarterback and spending less than $50,000 total) that determine the possible solution space.
Getting data & formulating the problem
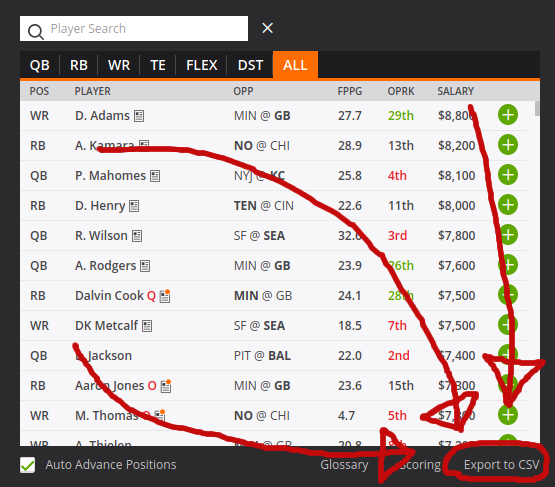
To keep things simple, I wanted to use data from only a single source. Conveniently, DraftKings provides the weekly Available Players data as a CSV download. From a contest entry page (on desktop), just click “Export to CSV”.
Let’s check out what’s in the data using Pandas. (All the Python code in this article is also on GitHub in a Jupyter Notebook.)
import pandas as pd
df = pd.read_csv('DKSalaries.csv')
df.sample(n=5)
In addition to each player’s name and unique ID, we get position, salary, team, game, and “AvgPointsPerGame”. Unfortunately, that means no historical data and no injury or roster data.
However, AvgPointsPerGame is intriguing: it’s a running average of the number of fantasy points earned by that player in all prior weeks of this season. The goal of a lineup is to earn the greatest number of fantasy points, so intuitively it seems like choosing players who have earned a high average point total in the past may do so in the future. It’s not a great metric (which we’ll talk more about later), but it’s good enough for our purposes: let’s build our lineups to optimize AvgPointsPerGame.
So what’s in a DraftKings NFL lineup? 9 total players, with several specific position requirements, and adding each player to our lineup costs a fixed “salary” amount: we need to spend less than $50,000 in total. So this is a constraint satisfaction problem: satisfy the lineup constraints, while maximizing AvgPointsPerGame. Let’s implement this in PuLP!
Building lineups with PuLP
Before solving, lets make sure the lineup contains only players we want to put in our lineup. While one could use plenty of game knowledge here, I’m just using two simple heuristics: don’t choose players if they’re injured (and thus will earn 0 points) and don’t choose players with a salary less than $4,000 (which almost always indicates players deep in the bench).
# 2020 has seen some Postponed games due to COVID; exclude those.
df = df[df['Game Info'] != 'Postponed']
# Exclude Injured and Questionable players
# Unfortunately, this list has to be populated manually
exclude_list = ['Emmanuel Sanders', 'Allen Lazard', 'Tim Patrick', 'Austin Ekeler', 'Jamison Crowder', 'Aaron Jones']
df = df[~df['Name'].isin(exclude_list)]
# Exclude non-DST players with very low salaries.
df = df[(df.Salary >= 4000)|(df['Roster Position'] == 'DST')]
len(df)
In Week 8 of the 2020 season, this left 244 eligible players.
Now, let’s formulate the problem with PuLP. First, we’ll define our variables, which are just binary indicators for each player that determine whether that player will be in our lineup or not. Note that we define the problem as a maximization rather than a minimization problem, since we want to choose a lineup that gives the greatest AvgPointsPerGame.
import pulp
prob = pulp.LpProblem('DK_NFL_weekly', pulp.LpMaximize)
player_vars = [pulp.LpVariable(f'player_{row.ID}', cat='Binary') for row in df.itertuples()]
Next, we need to add the lineup constraints to our LpProblem instance.
# total assigned players constraint
prob += pulp.lpSum(player_var for player_var in player_vars) == 9# total salary constraint
prob += pulp.lpSum(df.Salary.iloc[i] * player_vars[i] for i in range(len(df))) <= 50000# create a helper function to return the number of players assigned each position
def get_position_sum(player_vars, df, position):
    return pulp.lpSum([player_vars[i] * (position in df['Roster Position'].iloc[i]) for i in range(len(df))])

# for QB and DST, require 1 of each in the lineup
prob += get_position_sum(player_vars, df, 'QB') == 1
prob += get_position_sum(player_vars, df, 'DST') == 1# to account for the FLEX position, we allow additional selections of the 3 FLEX-eligible positions: RB, WR, TE
prob += get_position_sum(player_vars, df, 'RB') >= 2
prob += get_position_sum(player_vars, df, 'WR') >= 3
prob += get_position_sum(player_vars, df, 'TE') >= 1
Total Players in the lineup is the simplest constraint, so let’s start there. We just take a sum over the value of the player variables and ensure it equals 9. By adding a conditional to the LpProblem, we ensure that any solutions will make this condition true. Remember, each player variable is binary, so this constraint will force 9 of the player variables to be set to 1 and the rest to 0.
Total Salary is almost as easy, but we need to bring in Salary data from our dataframe. We again compute a sum, but this time we multiply each player variable by that player’s salary. This is equivalent to adding a player’s salary to our total when the player is included in the lineup and $0 otherwise. Then, we force this salary sum to be less than (or equal to) $50,000.
The most complicated constraint is the position constraints. The simpler two are the QB and DST positions; we use a helper function to check that only a single player in the lineup has a Roster Position of QB and DST, using the same sum approach we used for Total Salary.
We could use similar equality constraints for the remaining three positions (RB, WR, TE), but DraftKings lineups offer a “FLEX” position that can be any running back, wide receiver, or tight end. In other words, we can play either (3 RB, 3 WR, 1 TE), (2 RB, 4WR, 1 TE), or (2 RB, 3 WR, 2 TE) in our lineup. We can be a little clever here and exploit the combination of the constraints to avoid having to make a special constraint for the FLEX position. Instead, we add constraints insisting that the lineup include at least 2 RBs, 3 WRs, and 1 TE. But what if the lineup happened to include 4 RBs, which would meet the (RB ≥ 2) constraint but create an illegal lineup? Because we also have constraints for each of the other positions and there’s only 1 FLEX spot, we could never assign 4 RBs without violating at least one of the other position constraints or the total player constraints.
Finally, we’ll finish defining the problem by specifying the goal. Any non-boolean constraint will be taken as the maximization (or minimization) target. Just like with the Salary constraint, we compute a sum of the AvgPointsPerGame.
prob += pulp.lpSum([df.AvgPointsPerGame.iloc[i] * player_vars[i] for i in range(len(df))])Now that the problem is defined, we can solve:
# solve and print the status
prob.solve()
print(pulp.LpStatus[prob.status])
If everything is well defined, the problem solution should be “Optimal”, indicated that a single lineup was found that gives the greatest possible AvgPointsPerGame while still adhering to the lineup constraints.
To print the lineup, we just need to check which player variables in the solution were assigned to 1.
total_salary_used = 0
mean_AvgPointsPerGame = 0
for i in range(len(df)):
if player_vars[i].value() == 1:
row = df.iloc[i]
print(row['Roster Position'], row.Name, row.TeamAbbrev, row.Salary, row.AvgPointsPerGame)
total_salary_used += row.Salary
mean_AvgPointsPerGame += row.AvgPointsPerGame
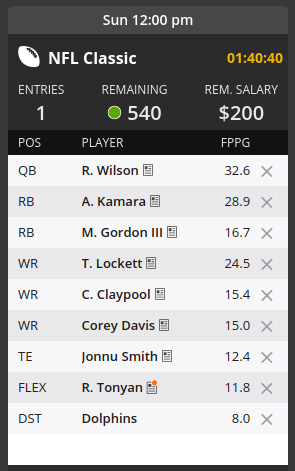
mean_AvgPointsPerGame /= 9 # divide by total players in roster to get a meanThe optimal lineup for Week 8 of the 2020 season uses $49,800 in salary and has an average of 18.37 AvgPointsPerGame. Here’s the lineup I received:
Analysis & Improvements
So how does this simple algorithm do? Well, if each player earned exactly their AvgPointsPerGame, then this lineup would receive 165.33 points, which is pretty reasonable. Okay, this is a high-variance sport and we don’t take match-ups into account, but this should be pretty good, right? Well, in Week 7 the “expected” value of my lineup was 169.79 points, which would have placed in the middle of the pack (as we might expect). What I actually scored was 115.82 points, good enough for a resounding last place finish. Did I just get unlucky? Unfortunately, I don’t think so.
Let’s take a look at Jonnu Smith, a player that ended up in both my Week 7 and Week 8 lineups. Last week, Jonnu Smith had an AvgPointsPerGame of 14.48 points but earned only 1.9 points. Why the huge discrepancy? Here’s what RotoWire has to say about Jonnu Smith’s Week 7 performance: “It’s unclear if was held back by the injury or tough matchup, but Smith turned in his second consecutive one-catch performance. Prior to this downturn in production, it appeared Smith was in for a breakout season by recording 13 receptions, 181 yards and three touchdowns in the team’s first three games. He’ll look to get back on track in Week 8 against Cincinnati.” (emphasis mine)
Jonnu Smith was performing better than he might have been expected to in the first 3 weeks of the season, which resulted in high point earnings and thus a high AvgPointsPerGame metric. But we should probably interpret high-performing weeks as essentially outliers; future weeks should see Jonnu Smith regressing to the mean. In fact, that’s exactly what happened. This problem is exacerbated by our specific measure of central tendency: averages will be more affected by outlier weeks. Even “MedianPointsPerGame” would be a more reasonable metric, but we would still expect to see significant regression-to-the-mean effects in such a short season. That doesn’t mean Jonnu Smith is a bad pick for this week, but it reveals a fundamental weakness in our use of the AvgPointsPerGame metric.
The weekly data + constraint satisfaction approach to DraftKings lineups isn’t great, but we had fun and learned a little about PuLP! You could use this constraint solver as the base for a better semi-automated lineup chooser by making a few improvements.
The simplest way to improve the performance of our constraint satisfaction algorithm would be to directly inject a little domain knowledge by manually choosing the set of eligible players. If you know something about football, you could select a few players for each position (including some low-salary sleeper picks) and then let the constraint solver help you choose within the total salary constraint.
Other obvious improvements involve incorporating additional data, such as information about the match-up or additional historical player data, and maximizing something other than AvgPointsPerGame. If you do use PuLP to help create your fantasy lineups , can you let me know how you used it? Otherwise, get out there and create your lineups the old-fashioned way: choosing your favorite players and complaining bitterly when they lose.
For more on using optimization techniques for fantasy sports lineups, check out this great blog post on NHL lineups that inspired my own attempt to create NFL lineups.